I’m an organizer. I’ve always documented projects, tracked finances, and built habits around standardized systems to make life easier. The initial time invested to set up a good process can save an immense amount of time later. When it comes to automotive maintenance, I’ve created ways to monitor my vehicles’ health, generate proactive service reminders, and track product orders and return history.
While those tasks can take different forms for different people, below are some of the ways I’ve approached streamlining them for my needs. We’ll start with the basics then work our way through some of the resulting dashboards. Buckle in.
Problem Solving
Maintenance trackers take many forms: from spiral-bound notebooks, to notes apps on cell phones, to the proverbial pile of receipts in a shoebox. They also exist as more robust solutions like spreadsheets, purpose-built mobile apps, paid subscription services in proprietary systems, or self-hosted, open-source software. Ultimately, the best system is the one that you understand and the one that you will consistently use. Regardless of whether they’re analog or digital, when these systems work well, they do so because they’re well organized and tailored to their users’ needs.

When I began tackling my own repairs (read the backstory here), I got tired of hunting through stacks of receipts and wanted a better way to find order numbers for warranties or returns. I also couldn’t rely on service reminders from dealerships anymore and needed to create a system for predicting future repairs and avoiding surprise breakdowns. I wanted to monitor my vehicle’s health and to track how much money was being spent to keep it well maintained. This led to my initial list of what a good maintenance system should entail.
Desired Features
- Tracking orders, especially those with lifetime warranties
- Predicting future repairs based on age or mileage
- Generating recurring service reminders
- Providing health dashboards for systems and components
- Compiling monthly and annual expense trends
While a car can experience periods of high maintenance and require time and effort to repair properly, the logging of those repairs should be as effortless as possible. My goal was to automate everything and have a frictionless experience with the most efficient data input possible. With those needs in mind, I started with Microsoft Excel then later migrated to Google Sheets in order to have online access and real-time mobile form submissions.
Expenses & Repair Logs
That initial spreadsheet set up a standardized framework that would become the backbone for additional features and functionality. Color coded and categorized, this list has served as my maintenance log for the last two decades of driving. The example below is a 4-month snapshot out of a 20-year maintenance log.
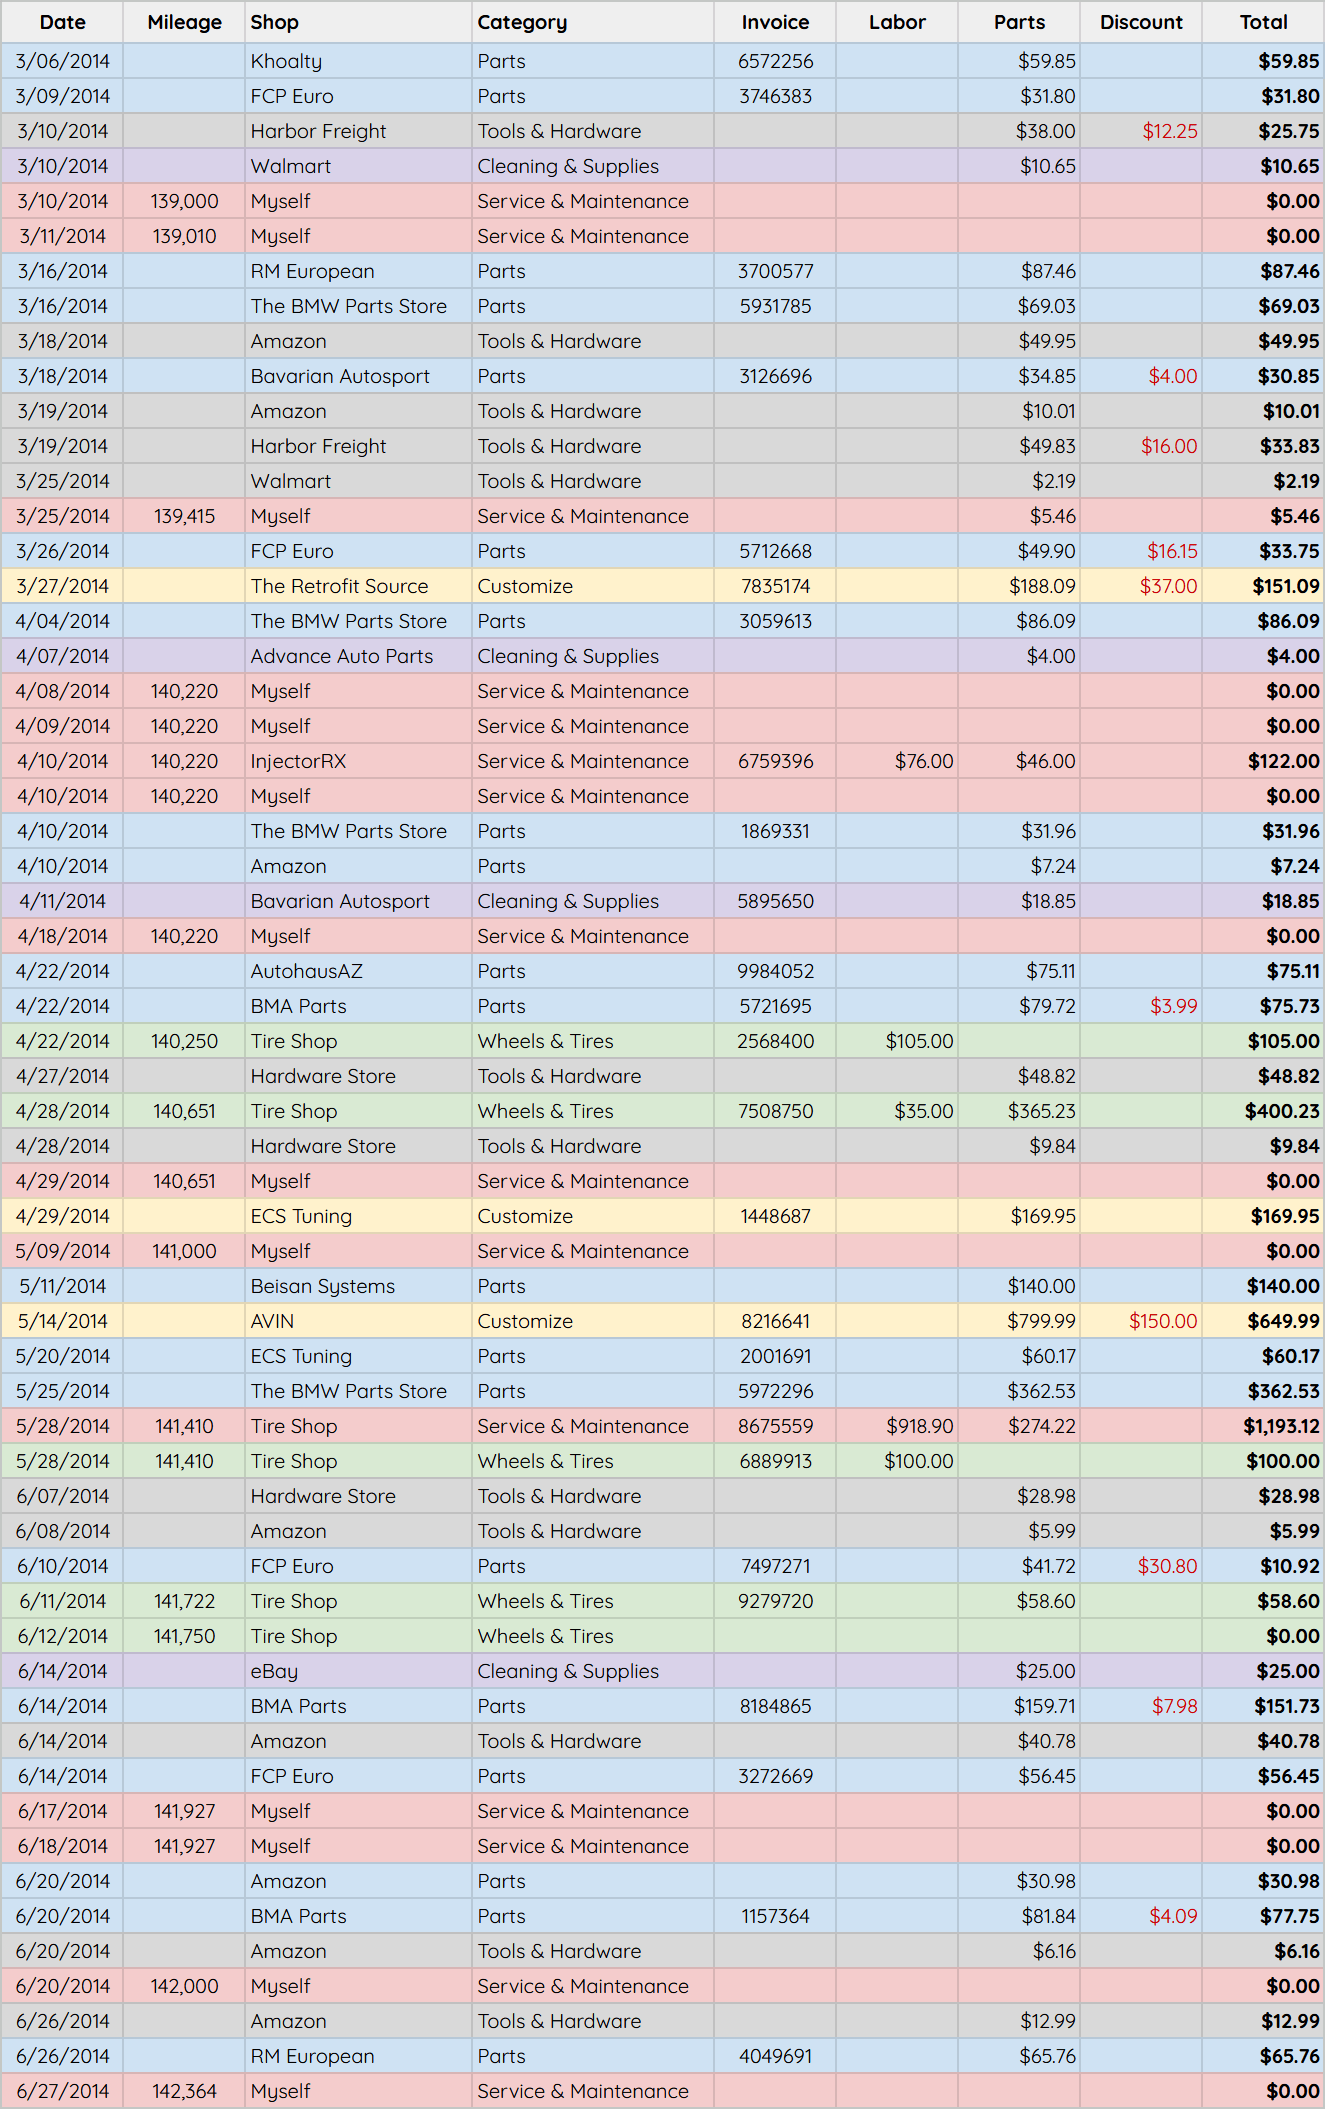
This list includes primary expense categories like parts (blue), labor (red), and tires (green). It also includes fields for shops, retailers, labor costs, part prices, and discounts. Additional columns track brands, part numbers, and general maintenance notes for future reference (not pictured in the screenshot above). Having part numbers on hand means the next time you place an order, there’s no need to look through invoices or consult a parts diagram. Tracking installation date and mileage helps forecast repairs for parts with known average lifespans.
Maintenance Intervals
After following a few dealer-recommended maintenance cycles, I decided to adjust the standard service guidelines to reflect my driving style and personal preferences. Every vehicle comes with recommended service intervals from the manufacturer, and while they’re decent guidelines, they may not always be applicable to your specific situation. I settled on a blend of factory recommendations, intervals compiled from community data, and my own experiences with specific brands and driving habits.
I noticed an exceptionally positive change to the driving dynamic from keeping tight service intervals on suspension components. Refreshing an aging suspension will roll back the clock and turn your vehicle’s handling from sleepy and unresponsive into nimble and alert. New shocks, struts, front control arm bushings (FCABs), and rear trailing arm bushings (RTABs) will have a profound impact on how your car drives. It’s one of the most rewarding areas to maintain on the E46 chassis.
With a fresh perspective on service intervals and how frequently parts needed to be replaced, I built and refined real-time health reports for major areas of the vehicle and a preventative maintenance tracker. This showed which parts were getting up there in mileage and which repairs could more efficiently be tackled together.

This schedule provides a granular view into individual parts and their expected lifespan, along with the ability to update preferred service frequency. The installation year and previous mileage for a component is automatically extracted from the repair log, and the next service or inspection interval is generated. Current wear-and-tear and remaining life is also calculated based on the most recent mileage entry in the repair log. This health report allowed me to stay on top of routine services and monitor aging components, and the intervals could even be used to drive proactive service reminders.
Proactive Maintenance
It’s helpful to schedule repairs on your own time rather than when the vehicle demands them. Repairs left unaddressed can often compound and lead to larger issues, so it’s wise to plan ahead! By combining repair data with adjustable maintenance intervals, I could isolate parts by installation year, mileage remaining, and expected service life.
The example below shows all components replaced prior to 2026 with less than 25,000 miles remaining and less than 30% expected service life left.
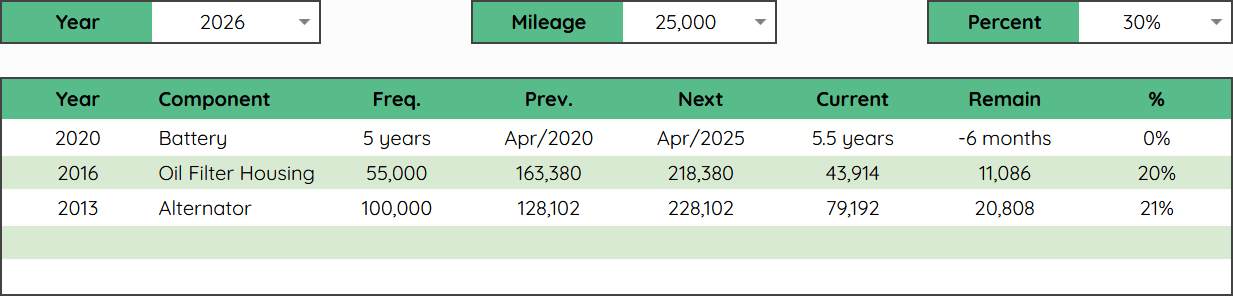
What this highlights is over the next 15,000 miles or so, I’ll need to tackle the oil filter housing gasket (OFHG) and the alternator, as well as plan for a new battery. This preventative maintenance list automatically updates based on ongoing repair log entries and can send email reminders based on custom thresholds and preferred scheduling. As each item comes up for repair, I turn to the collection of DIY instructions I’ve gathered over the years to tackle them.
Health Dashboards
Long lists of maintenance data don’t always make for compelling reading, so I created ways to represent it visually. These dashboards also helped maintain consistent data logging habits because they provided up-to-date health statuses for my car. It takes a while to build a consistent routine around logging repairs, but it’s worth it when you’re able to create and automate real-time insights. The example below is my primary dashboard for viewing broad system health statuses.

Each core system is comprised of individual components which also serve as a proxy for other related maintenance items. The health percentages are driven by elapsed time or remaining service life, as shown in the previous section. You’ll also notice the items that were flagged in the proactive maintenance report above (the battery, oil filter housing gasket, and alternator) all show up here as either red or orange. Any item that reaches 0% is flagged by a full, red health bar rather than disappearing completely from the dashboard.
Expense Trends
Maintenance logs and digital dashboards are a great way to track and visualize the health of a car, and they also give insight into that all important question of the cost of ownership. That number will vary greatly depending on part quality, labor cost, driving environment, and proactiveness, among other factors. Below are my expenses broken out by year and category for the last 20 years. Some of these are hard costs and required repairs, while others are soft costs and optional performance upgrades or creature comforts added over the years.

Charting the data highlights key ownership milestones: the high costs of labor from going to dealerships and independent shops early on, my foray into DIYing and exploring the world of online European parts vendors, followed by several years of stability, and then one of the more recent overhauls and system refresh projects. Below is that same data in table form.
Expenses by Year & Category
| Year | Labor | Parts | Tires | Customize | Cleaning | Tools | Total |
| 2007 | $0.00 | $0.00 | $0.00 | $0.00 | $0.00 | $0.00 | $0.00 |
| 2008 | $1,249.98 | $845.71 | $20.00 | $133.50 | $0.00 | $0.00 | $2,249.19 |
| 2009 | $1,988.82 | $1,424.90 | $1,034.91 | $646.98 | $0.00 | $0.00 | $5,095.61 |
| 2010 | $2,027.14 | $1,994.29 | $0.00 | $35.98 | $0.00 | $0.00 | $4,057.41 |
| 2011 | $1,424.42 | $1,439.18 | $873.29 | $0.00 | $0.00 | $0.00 | $3,736.89 |
| 2012 | $32.11 | $48.82 | $766.21 | $1,745.00 | $0.00 | $0.00 | $2,592.14 |
| 2013 | $1,242.52 | $2,305.79 | $0.00 | $926.22 | $362.63 | $351.82 | $5,188.98 |
| 2014 | $1,175.55 | $3,882.85 | $663.83 | $1,345.33 | $138.87 | $304.44 | $7,510.87 |
| 2015 | $57.94 | $2,041.71 | $849.26 | $1,139.18 | $207.87 | $254.94 | $4,550.90 |
| 2016 | $0.00 | $1,924.30 | $0.00 | $26.16 | $0.00 | $0.00 | $1,950.46 |
| 2017 | $0.00 | $715.79 | $0.00 | $84.40 | $13.21 | $0.00 | $813.40 |
| 2018 | $0.00 | $107.18 | $-227.00 | $1,176.79 | $70.00 | $-120.00 | $1,006.97 |
| 2019 | $0.00 | $177.97 | $0.00 | $35.37 | $0.00 | $0.00 | $213.34 |
| 2020 | $0.00 | $1,210.39 | $210.00 | $919.15 | $0.00 | $17.39 | $2,356.93 |
| 2021 | $0.00 | $49.92 | $0.00 | $0.00 | $0.00 | $0.00 | $49.92 |
| 2022 | $0.00 | $0.00 | $337.89 | $0.00 | $0.00 | $0.00 | $337.89 |
| 2023 | $1,450.00 | $3,022.87 | $1,038.44 | $0.00 | $0.00 | $0.00 | $5,511.31 |
| 2024 | $1,650.00 | $1,522.86 | $0.00 | $0.00 | $0.00 | $156.28 | $3,329.14 |
| 2025 | $0.00 | $63.80 | $0.00 | $0.00 | $30.82 | $72.38 | $167.00 |
| 2026 | $0.00 | $101.38 | $0.00 | $0.00 | $0.00 | $0.00 | $101.38 |
| Total | $12,298.48 | $22,879.71 | $5,566.83 | $8,214.06 | $823.40 | $1,037.25 | $50,819.73 |
Cost/Year
With this data, the lifetime cost of ownership is easy to calculate. The black line in the chart below represents total annual expenses. (The red line is annual mileage because of course I logged that, too.) This annual expense number, however, represents total expenses and includes some discretionary costs. If you focus on “Labor,” “Parts,” and “Tires” (which could all be considered essential categories) and ignore others like “Customize” (which accounts for the majority of non-essential spending), primary upkeep for the last 20 years is around $40,000 (~$2,000/year). That number continues to improve as you look at trailing 10 and 5-year intervals, getting further away from the early years of dealerships and closer to present-day DIYs. Today, maintenance and upkeep hovers around $1,000/year.

| Category | 20 Years | $/Year |
| Labor | $12,298.48 | $614.92 |
| Parts | $22,879.71 | $1,143.99 |
| Tires | $5,566.83 | $278.34 |
| $40,745.02 | $2,037.25 |
Reflections
Looking back, it’s been helpful to track expenses and to be able to compare ownership costs with, say, that of a newer vehicle. Skill, ability, and desire to DIY will obviously impact ownership costs.
Looking at annual expenses and projecting out into the future, keeping this car on the road hasn’t been a frivolous financial decision. Besides, even if it was, it’s been worth every penny. There’s no amount of money that could replace the thrill of outrunning rainstorms with the top down, the peacefulness of evening drives beneath the stars, or the excitement of discovering freshly paved winding roads. It’s been a rewarding learning experience being engrossed in the E46 platform.
However you decide to structure or organize your own maintenance efforts, take the time to identify what your nice-to-haves and need-to-haves are and whether you want to build or buy a potential solution. Remember that the best system is the one you understand and the one you’ll consistently use. Prioritize a service that’s reliable, keeps your data portable, and is likely to endure over the years. Don’t hesitate to test a few approaches before fully committing, either. Experiments and exploration are productive even if they produce different results than what you expected.